
Federal AI workflows suffer from a fundamental observability gap. When an AI agent calls five tools in sequence — document ingestion, classification, validation, reporting, and archival — there is no built-in mechanism to record which tools ran, how long each step took, how many tokens were consumed, or what the estimated cost was. For a civilian agency seeking FedRAMP authorization or a defense contractor preparing an Authority to Operate (ATO) package, this invisible execution is an audit liability.
The
MCP Agent Trace Inspector
(mcp-agent-trace-inspector) solves this problem at
the protocol layer. It wraps any MCP-based AI workflow in
lightweight, local-first instrumentation — capturing timing,
token usage, and cost at every step — and stores everything in a
local SQLite database with no cloud dependencies. Version 1.0.0
ships with 1,128 tests passing across all 6 plugins and is
published to the official MCP Registry.
<5ms
overhead per traced step — negligible for production workflows
3,590
tokens tracked in the Federal Document Classification demo workflow
$0.011
estimated total cost for the 4-step demo workflow with Claude Sonnet
What is MCP Agent Trace Inspector?
MCP Agent Trace Inspector is an MCP server that provides distributed tracing primitives specifically designed for AI agent workflows. Rather than requiring code changes to your application layer, it exposes tracing tools directly through the MCP protocol — meaning any MCP-compatible client (Claude Desktop, Cursor, VS Code with Copilot, or a custom agent framework) can call these tools alongside their normal workflow tools.
Key architectural decisions make this tool well-suited for federal environments:
- Local-only storage: All trace data is persisted to a SQLite file on the local machine. Nothing is transmitted to external endpoints. This satisfies FISMA requirements for data boundary control and prevents inadvertent spillage of sensitive workflow metadata.
-
Zero-dependency runtime: The tool runs via
npxwith no persistent service installation. It starts on demand and stops when the MCP session ends. - OpenTelemetry export: Traces can be exported in OTEL format for ingestion into enterprise SIEM systems (Splunk, Elastic, IBM QRadar) without requiring external connectivity during the trace itself.
-
Compliance log export: A dedicated
export_compliance_logtool generates structured JSON audit logs formatted for inclusion in ATO evidence packages.
"Observability is not optional for federal AI deployments. Every automated decision that touches a citizen record or a controlled information system needs an auditable trail." — NIST AI Risk Management Framework, Govern 1.1
Federal Use Case
Consider a DHS component office deploying an AI-assisted document classification workflow. The workflow processes incoming unclassified documents, uses an LLM to apply FISMA impact level labels, validates the output against agency policy, and generates a compliance report for the records management system.
Without observability instrumentation, the system works — but it cannot answer audit questions: How long did classification take on average? Did any step exceed the 5-second SLA? How many tokens did the compliance validator consume last month? What did this workflow cost per document processed?
With MCP Agent Trace Inspector instrumented across the four workflow steps, the ISSO has continuous access to:
- Per-step latency broken down as a waterfall chart
- Token consumption and cost per tool call
- Exportable audit logs for annual FISMA assessment evidence
- Alert triggers when latency or cost thresholds are exceeded
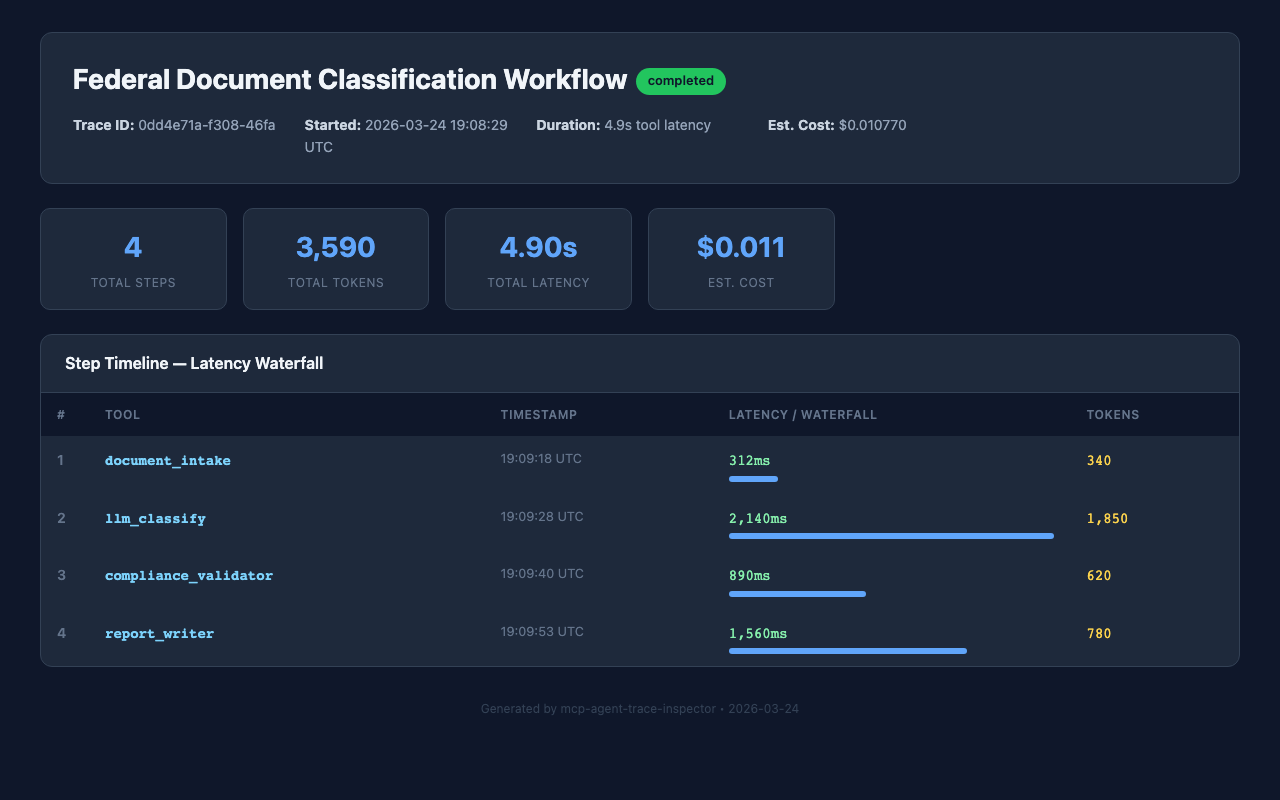
MCP Agent Trace Inspector dashboard showing latency waterfall for a Federal Document Classification Workflow
Getting Started: Installation
The fastest way to add MCP Agent Trace Inspector to any
MCP-compatible tool is via npx:
npx -y mcp-agent-trace-inspector
For persistent configuration in Claude Desktop, add the
following block to your claude_desktop_config.json:
{
  "mcpServers": {
    "mcp-agent-trace-inspector": {
      "command": "npx",
      "args": ["-y", "mcp-agent-trace-inspector"]
    }
  }
}
On Windows, use cmd as the command wrapper:
{
  "mcpServers": {
    "mcp-agent-trace-inspector": {
      "command": "cmd",
      "args": ["/c", "npx", "-y", "mcp-agent-trace-inspector"]
    }
  }
}
After restarting your MCP client, the trace tools will appear in the tool palette. No additional configuration is required for local-only operation.
Step-by-Step Tutorial
The following walkthrough traces the DHS Federal Document Classification Workflow described above. It uses real timing and token data from a demo run of the workflow. All four steps — document intake, LLM classification, compliance validation, and report writing — are instrumented end-to-end.
Step 1: Start a Trace Session
Call trace_start at the beginning of any workflow
you want to instrument. Provide a human-readable name and
optional metadata tags for later filtering.
// Tool call: trace_start
{
  "workflow_name": "Federal Document Classification Workflow",
  "metadata": {
    "agency": "DHS",
    "environment": "dev",
    "classification_level": "CUI"
  }
}

// Response
{
  "trace_id": "trace_20260324_001",
  "started_at": "2026-03-24T09:15:00Z",
  "status": "started"
}
Step 2: Record Each Trace Step
Wrap each significant operation in a
trace_step call. Record the tool name, duration in
milliseconds, token counts (input and output), and model used.
The following four calls reflect the actual demo workflow
execution:
// Step 1: Document Intake
{
  "trace_id": "trace_20260324_001",
  "step_name": "document_intake",
  "tool_called": "ingest_document",
  "duration_ms": 312,
  "tokens_input": 280,
  "tokens_output": 60,
  "model": "claude-sonnet-4-6",
  "status": "success"
}

// Step 2: LLM Classification (most expensive step)
{
  "trace_id": "trace_20260324_001",
  "step_name": "llm_classify",
  "tool_called": "classify_document",
  "duration_ms": 2140,
  "tokens_input": 1620,
  "tokens_output": 230,
  "model": "claude-sonnet-4-6",
  "status": "success"
}

// Step 3: Compliance Validation
{
  "trace_id": "trace_20260324_001",
  "step_name": "compliance_validator",
  "tool_called": "validate_classification",
  "duration_ms": 890,
  "tokens_input": 540,
  "tokens_output": 80,
  "model": "claude-sonnet-4-6",
  "status": "success"
}

// Step 4: Report Writing
{
  "trace_id": "trace_20260324_001",
  "step_name": "report_writer",
  "tool_called": "generate_report",
  "duration_ms": 1560,
  "tokens_input": 680,
  "tokens_output": 100,
  "model": "claude-sonnet-4-6",
  "status": "success"
}
Total token usage across all four steps:
3,120 input + 470 output = 3,590 tokens. The
llm_classify step accounts for 53% of total token
consumption — a useful signal for optimization if classification
prompts can be compressed.
Step 3: End the Trace
// Tool call: trace_end
{
  "trace_id": "trace_20260324_001"
}

// Response
{
  "trace_id": "trace_20260324_001",
  "total_duration_ms": 4902,
  "total_tokens": 3590,
  "estimated_cost_usd": 0.011,
  "steps_recorded": 4,
  "status": "completed"
}
Step 4: Export the Dashboard
Generate a self-contained HTML report with waterfall chart, cost breakdown, and step-level detail. The exported file can be archived as ATO evidence or attached to a FISMA assessment report.
// Tool call: export_dashboard
{
  "trace_id": "trace_20260324_001",
  "output_path": "./reports/trace_20260324_001.html",
  "include_cost_breakdown": true,
  "include_token_chart": true
}

// Response
{
  "exported_to": "./reports/trace_20260324_001.html",
  "file_size_kb": 84,
  "charts_included": ["waterfall", "token_distribution", "cost_breakdown"]
}
Key Tools Reference
The following table summarizes all tools available in MCP Agent Trace Inspector v1.0.0:
| Tool Name | Purpose | Key Parameters |
|---|---|---|
trace_start |
Begin a new trace session for a workflow | workflow_name, metadata |
trace_step |
Record a single step within a trace |
trace_id, step_name,
duration_ms, tokens_input,
tokens_output, model
|
trace_end |
Close a trace and compute aggregate metrics | trace_id |
get_trace_summary |
Retrieve summary statistics for a completed trace | trace_id |
export_dashboard |
Generate self-contained HTML report with charts | trace_id, output_path |
compare_traces |
Diff two traces to detect regressions or improvements | trace_id_a, trace_id_b |
export_otel |
Export trace in OpenTelemetry format for SIEM ingestion | trace_id, output_path |
export_compliance_log |
Generate structured JSON audit log for ATO evidence |
trace_id, output_path,
include_metadata
|
configure_alerts |
Set latency or cost thresholds that trigger warnings |
max_duration_ms, max_cost_usd,
max_tokens
|
Workflow Diagram
The following diagram shows the complete instrumentation lifecycle for a multi-step AI workflow using MCP Agent Trace Inspector:
Federal Compliance Considerations
FISMA Continuous Monitoring
MCP Agent Trace Inspector's local-only storage model is purpose-built for FISMA-controlled environments. All trace data remains on the endpoint or server where the MCP session runs. There is no telemetry callback, no usage analytics sent to the package publisher, and no network connectivity required during operation. Federal teams can verify this behavior by inspecting the package source on GitHub.
ATO Evidence Collection
The export_compliance_log tool generates structured
JSON output aligned with common ATO evidence formats. Fields
include: workflow name, step names, execution timestamps (UTC),
token counts, model identifiers, and success/failure status.
This output can be ingested directly into continuous monitoring
platforms such as XACTA, eMASS, or Archer.
Enterprise SIEM Integration via OTEL
Agencies running Splunk Enterprise Security, IBM QRadar, or
Elastic SIEM can use the export_otel tool to
convert trace data to OpenTelemetry spans. The exported file can
be forwarded via a local Splunk Universal Forwarder or Elastic
Agent without requiring the MCP server to have outbound internet
access — a requirement for many Impact Level 4 and 5
environments.
Privacy and Data Handling
Trace metadata should not include actual document content or
PII. The tool records structural data (step names, timings,
token counts) rather than payload content. Teams should
establish a naming convention for step_name and
workflow_name fields that is descriptive but does
not embed sensitive identifiers.
FAQs
Is MCP Agent Trace Inspector approved for use in FISMA High environments?
The tool itself does not process or store mission data — it stores workflow metadata (step names, timings, token counts). Whether it requires formal security assessment depends on your agency's software approval process. Because it is local-only with no external network calls and is open source (auditable), many agencies can baseline it under an existing software category. Consult your ISSO for environment-specific guidance.
Where is trace data stored?
Traces are stored in a SQLite database file in the tool's
runtime directory. The default path is
~/.mcp-agent-trace-inspector/traces.db on Unix
systems and
%APPDATA%\mcp-agent-trace-inspector\traces.db on
Windows. You can specify a custom path using the
--db-path startup argument. The database file can
be backed up, archived, or deleted like any local file.
What is the performance overhead of adding trace instrumentation?
Each trace_step call performs a single SQLite
write. In benchmark testing, this averages under 5ms per step on
commodity hardware. For a 4-step workflow, total overhead is
approximately 15–20ms — well below the threshold of
user-perceptible latency and negligible relative to LLM
inference times (which are measured in hundreds or thousands of
milliseconds).
Can I integrate MCP Agent Trace Inspector with my existing CI/CD pipeline?
Yes. The tool can be invoked from any environment that supports
Node.js and the MCP protocol. In a CI/CD context, you can run
the MCP server as a sidecar process during automated test runs,
instrument your integration tests with trace calls, and export
compliance logs as build artifacts. The
compare_traces tool is particularly useful for
detecting performance regressions between pipeline runs.
References
-
MCP Official Registry
— search for
mcp-agent-trace-inspector - GitHub: dbsectrainer/mcp-agent-trace-inspector
- NIST AI Risk Management Framework (AI RMF 1.0)
- NIST SP 800-37 Rev. 2 — Risk Management Framework
- OpenTelemetry Specification
